Data report ·
Window Replacement Need Index
The estimated share of owner-occupied homes still on mostly original windows from before 2000, for all 387 U.S. metro areas. It's modeled from federal survey and Census data collected 2020 to 2023, and it shows where windows are old, not where they've failed.
Short answer
An estimated 36.6% of U.S. owner-occupied homes, about 30.3 million, still have mostly original windows from before 2000. Metro estimates run from 53.9% in Carson City, NV down to 19.1% in Wildwood-The Villages, FL. Among the 34 biggest metros, Miami, FL is highest at 46.4% and New York, NY lowest at 28.6%.
Modeled from EIA RECS 2020 and Census ACS 2019–2023 (B25036). Margins are 90% confidence. How we built it →
30.3M
owner-occupied homes still on original windows from before 2000
Source: EIA RECS 2020, Census ACS
53%
of those homes were built in the 1980s or 1990s
Source: EIA RECS 2020, Census ACS
31%
of homes built before 1950 still have their original windows
Source: EIA RECS 2020
What the numbers show
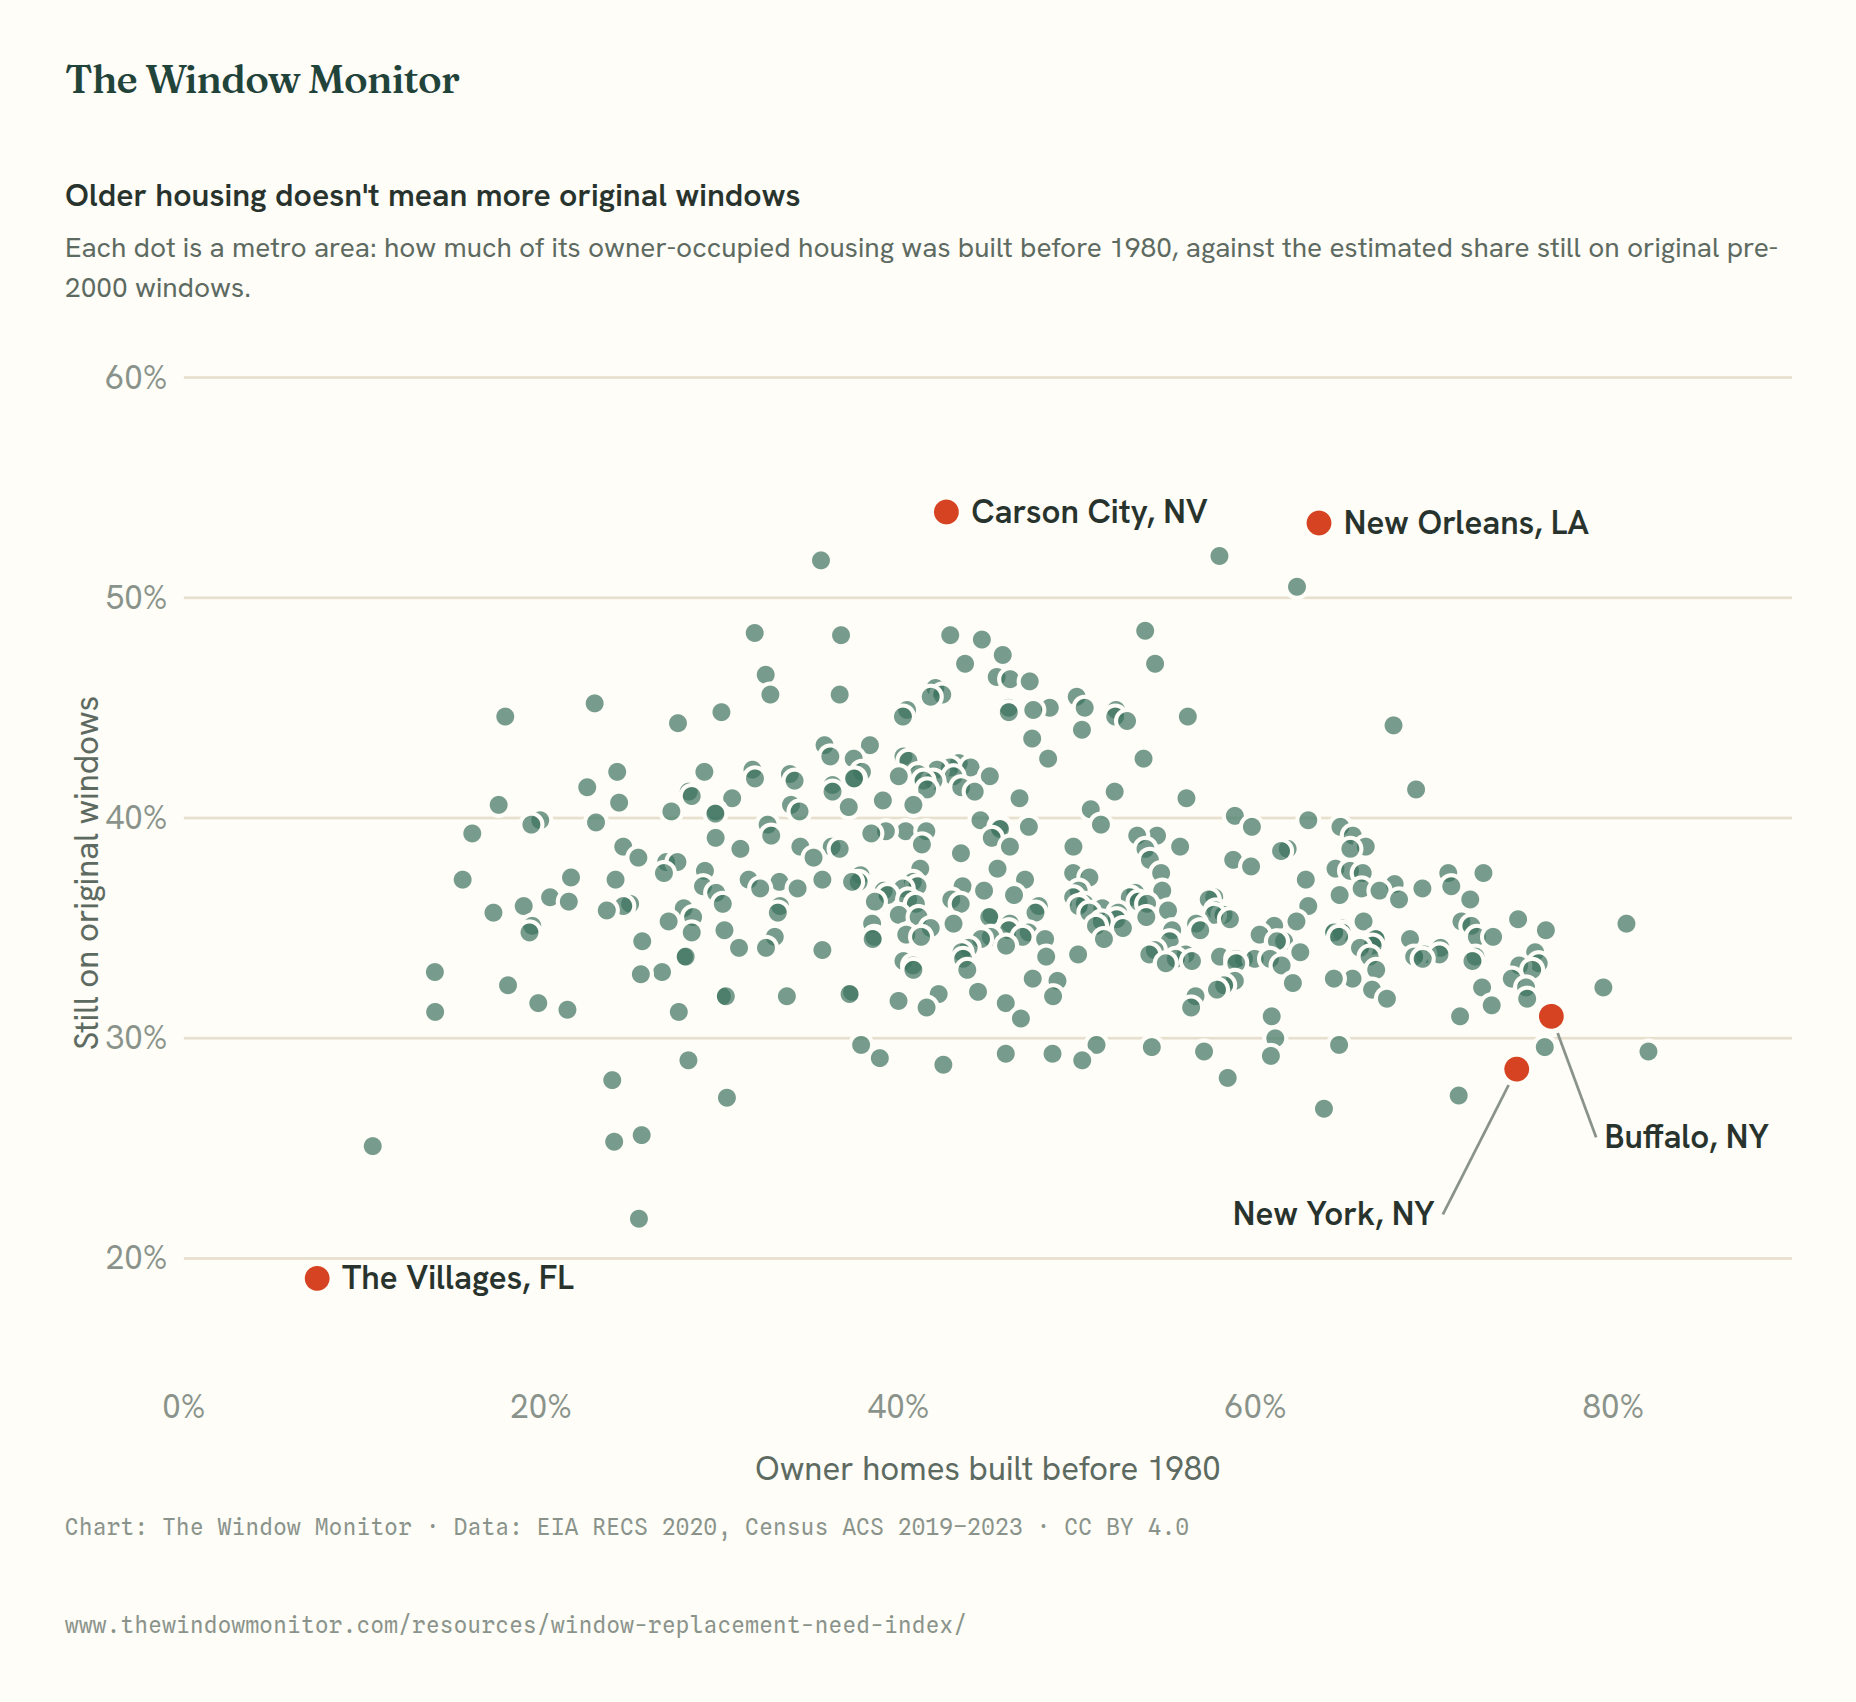
An old house doesn't mean old windows. Buffalo, NY and New York, NY have some of the oldest owner-occupied housing in the country. Roughly 75–77% of homes in each were built before 1980, which puts them 4th and 14th of 387 on housing age. Yet they rank 359th and 377th here. Of the 25 metros with the oldest housing, 23 fall in the bottom half. The pattern comes from the survey: nationally, owners of older homes mostly report replacement windows, and the model carries that into each metro. It doesn't measure any one city's replacement history.
Older housing doesn't mean more original windows
Each dot is a metro area: how much of its owner-occupied housing was built before 1980, against the estimated share still on original pre-2000 windows.
Chart: The Window Monitor · Data: EIA RECS 2020, Census ACS 2019–2023 · CC BY 4.0
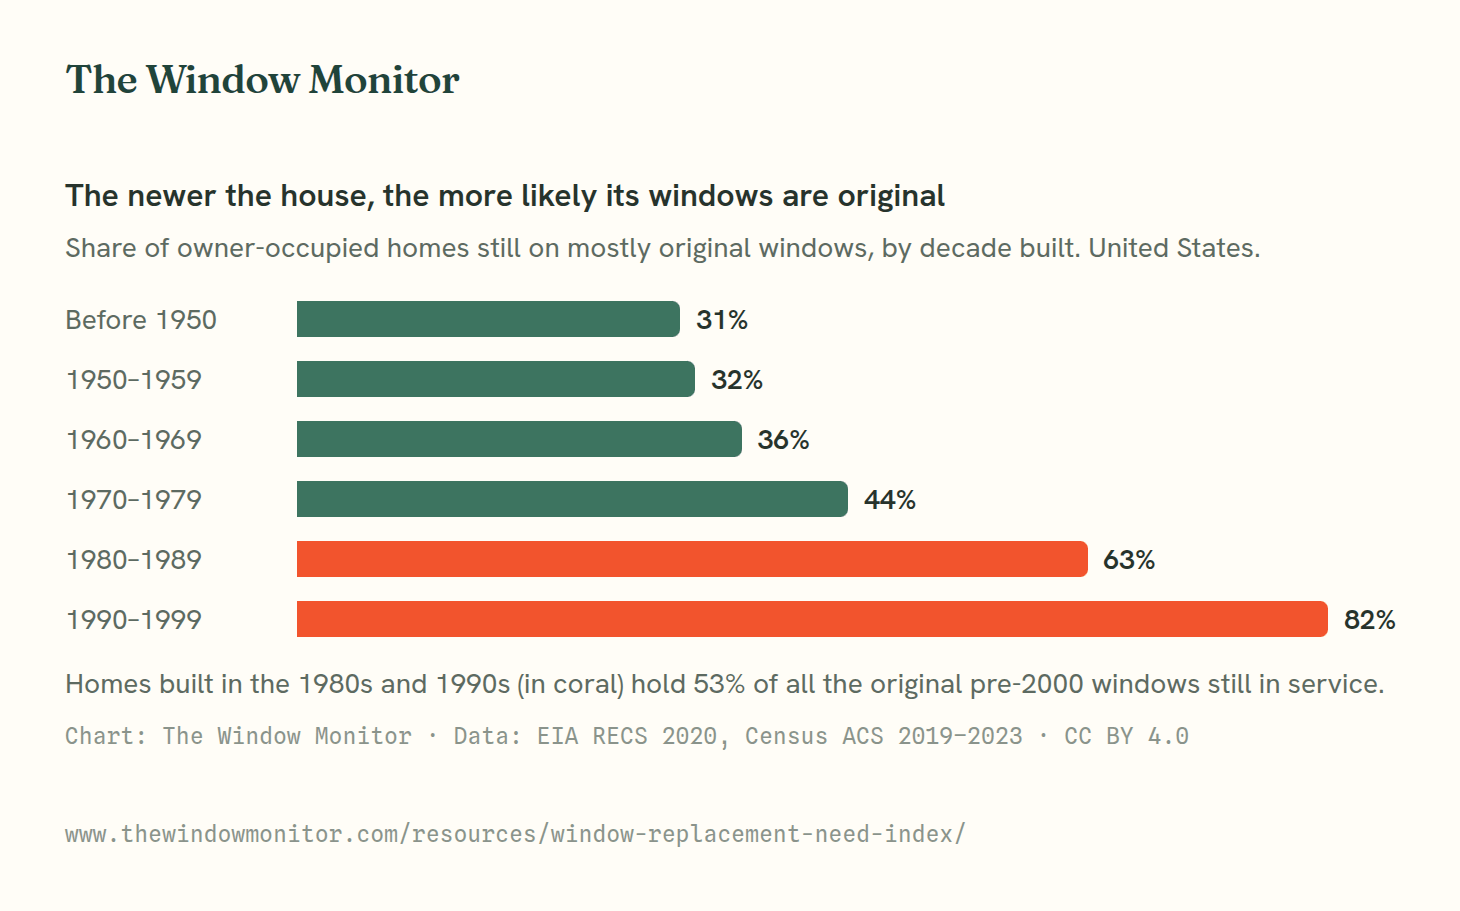
The real backlog is younger. Homes built in the 1980s and 1990s hold 53% of the original pre-2000 windows still in service: 63% of 1980s homes and 82% of 1990s homes haven't replaced them. Those windows are now 25 to 45 years old, and by the survey's count 46% of them have aluminum frames.
The newer the house, the more likely its windows are original
Share of owner-occupied homes still on mostly original windows, by decade built. United States.
Chart: The Window Monitor · Data: EIA RECS 2020, Census ACS 2019–2023 · CC BY 4.0
Region matters as much as age. In Texas, Oklahoma, Louisiana and Arkansas, 57% of homeowners in homes built before 1950 report original windows. In New York, New Jersey and Pennsylvania it's 22%. The survey shows the gap but not the reason for it. Between that gap and plenty of 1970s and 1980s housing, 42 of the top 50 metros are in the South.
The lowest shares belong to places that grew fast after 2000. Wildwood-The Villages, FL is mostly a retirement community built in the last two decades, and the Mountain West metros near the bottom, such as Provo, St. George and Greeley, are full of newer homes.
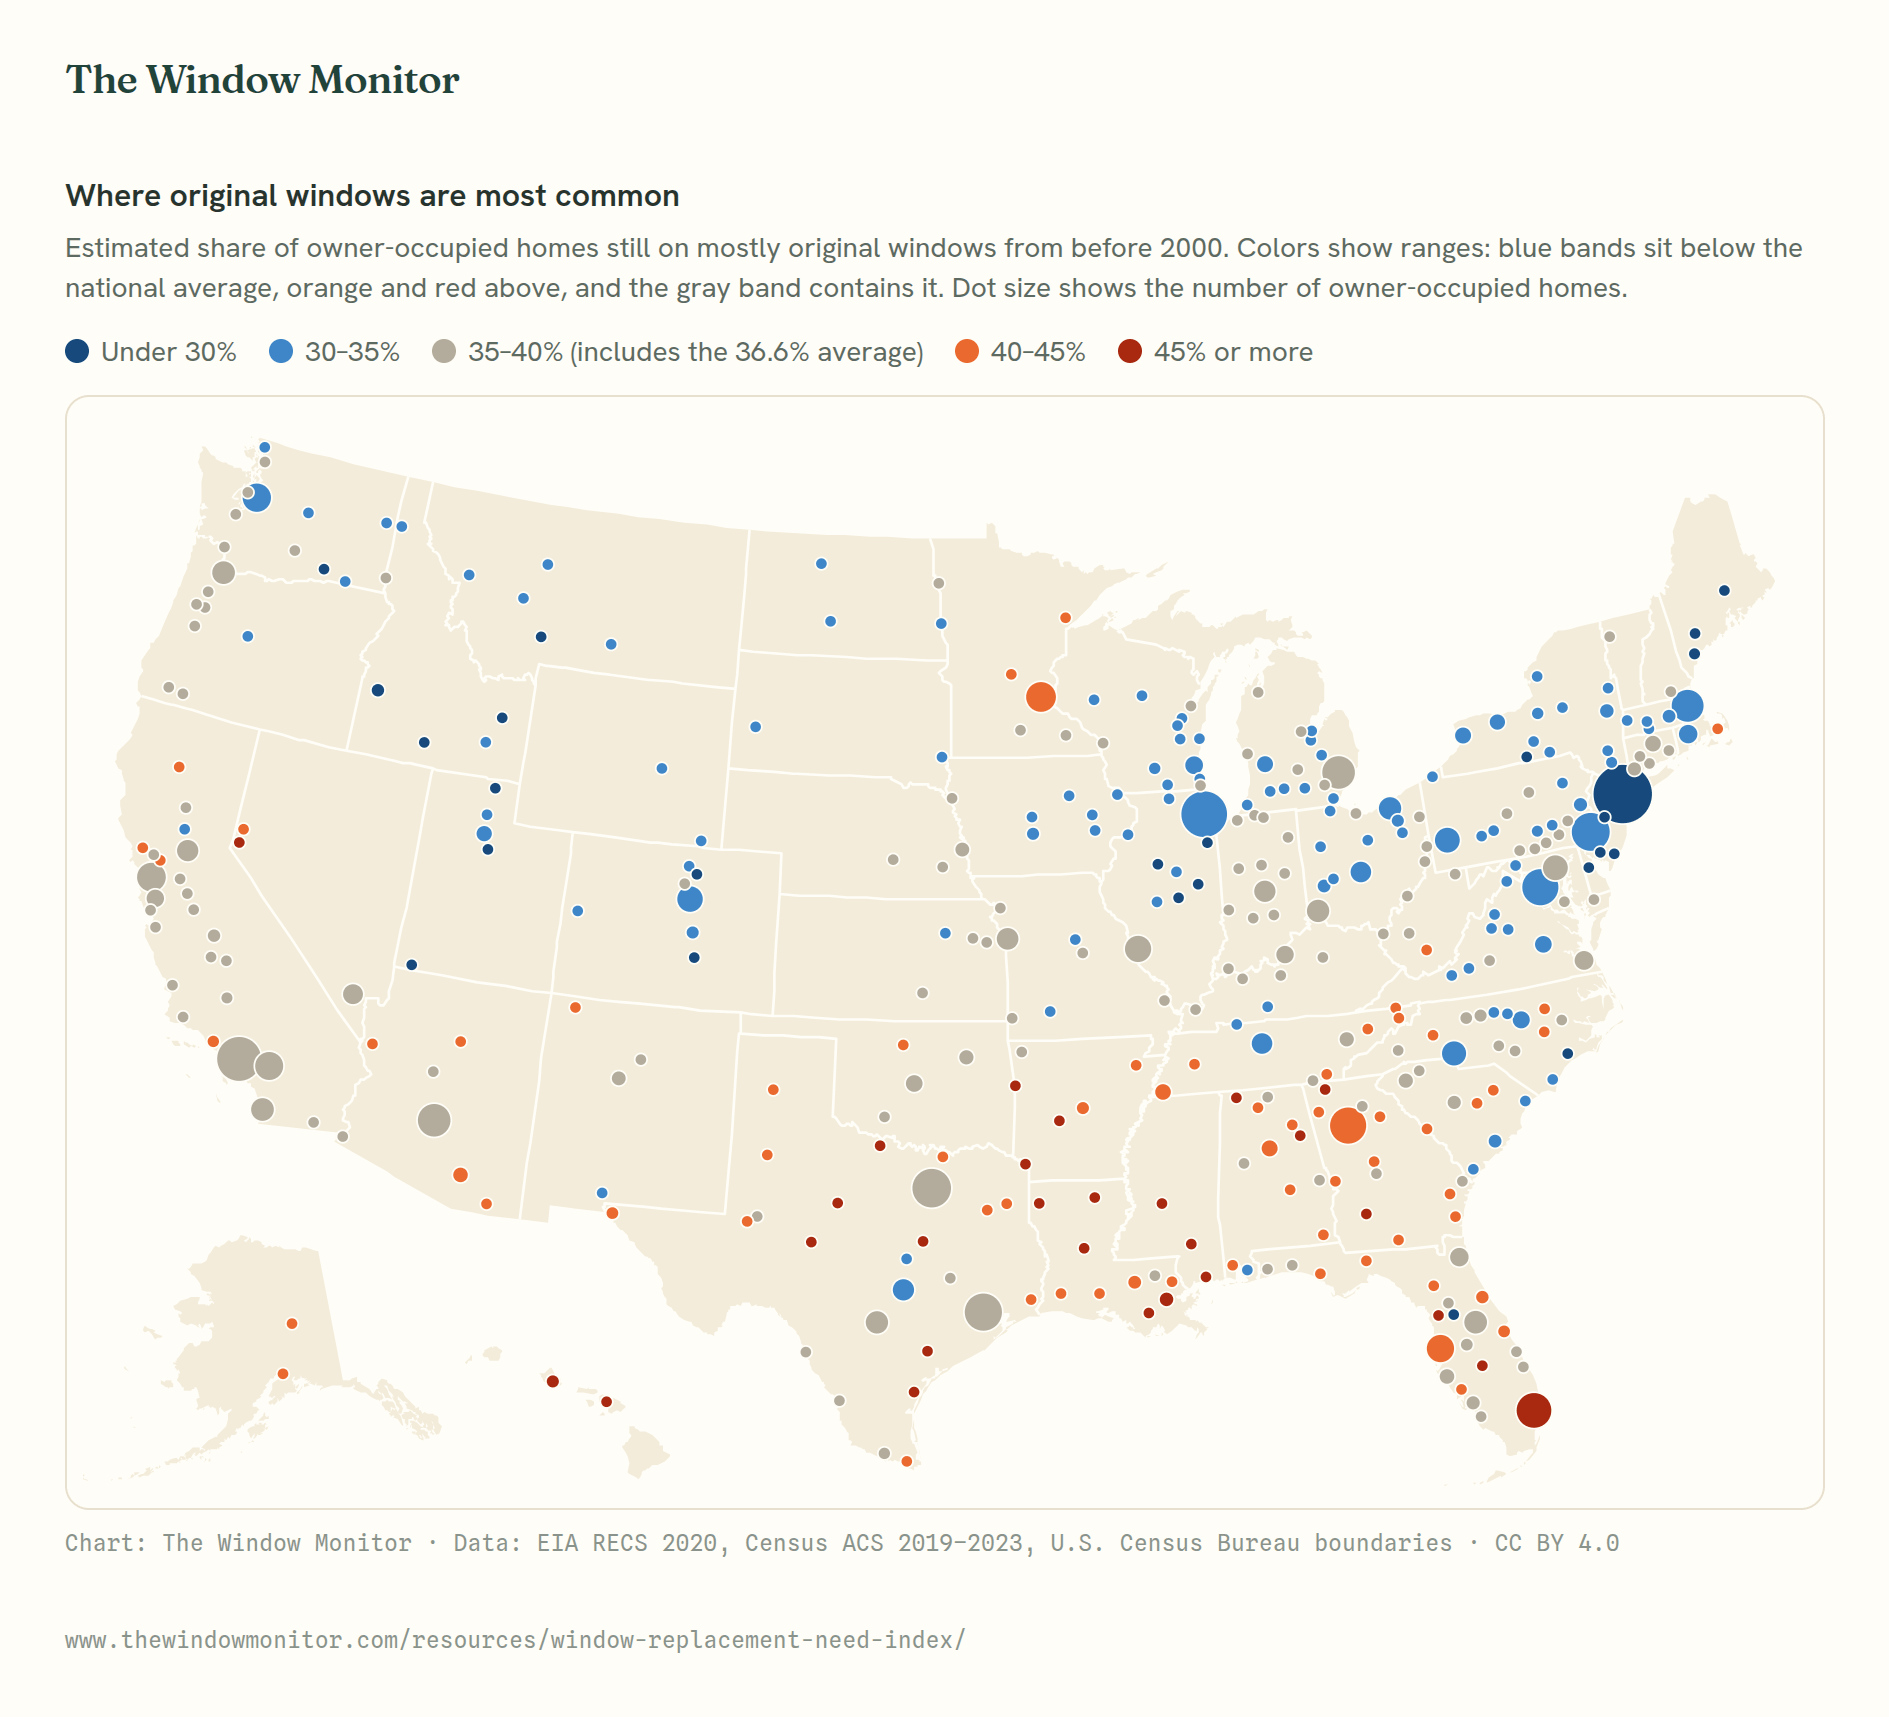
Where original windows are most common
Estimated share of owner-occupied homes still on mostly original windows from before 2000. Colors show ranges: blue bands sit below the national average, orange and red above, and the gray band contains it. Dot size shows the number of owner-occupied homes.
- Under 30%
- 30–35%
- 35–40% (includes the 36.6% average)
- 40–45%
- 45% or more
Chart: The Window Monitor · Data: EIA RECS 2020, Census ACS 2019–2023, U.S. Census Bureau boundaries · CC BY 4.0
All 387 metro areas
Estimated share of owner-occupied homes with mostly original windows from before 2000, with a 90% margin of error. Climate columns are context and don't affect the rank. Metro names link to our local guide where we have one.
| 1 | Carson City, NV | 53.9% ±6.4 | 8,100 | 1.2 | 40 | Low |
| 2 | New Orleans-Metairie, LA | 53.4% ±4.7 | 128,000 | 0.0 | 106 | Moderate |
| 3 | Urban Honolulu, HI | 51.9% ±5.2 | 104,000 | 0.0 | 32 | High |
| 4 | Kahului-Wailuku, HI | 51.7% ±4.3 | 19,000 | 0.0 | 39 | Low |
| 5 | Wichita Falls, TX | 50.5% ±3.0 | 18,000 | 0.0 | 105 | Moderate |
| 6 | San Angelo, TX | 48.5% ±2.9 | 15,000 | 0.0 | 119 | Low |
| 7 | Sebring, FL | 48.4% ±4.0 | 18,000 | 0.0 | 118 | High |
| 8 | Jackson, MS | 48.3% ±4.6 | 77,000 | 0.0 | 85 | High |
| 9 | Texarkana, TX-AR | 48.3% ±2.8 | 18,000 | 0.0 | 82 | Moderate |
| 10 | Monroe, LA | 48.1% ±4.0 | 26,000 | 0.0 | 97 | High |
| 11 | Houma-Bayou Cane-Thibodaux, LA | 47.4% ±3.9 | 29,000 | 0.0 | 76 | High |
| 12 | Abilene, TX | 47.0% ±2.9 | 20,000 | 0.0 | 102 | Moderate |
| 13 | Albany, GA | 47.0% ±4.4 | 15,000 | 0.0 | 88 | High |
| 14 | Dalton, GA | 46.5% ±4.0 | 17,000 | 0.0 | 38 | High |
| 15 | Miami-Fort Lauderdale-West Palm Beach, FL | 46.4% ±4.1 | 648,000 | 0.0 | 75 | High |
| 16 | Shreveport-Bossier City, LA | 46.3% ±3.8 | 45,000 | 0.0 | 96 | Moderate |
| 17 | Victoria, TX | 46.2% ±2.7 | 12,000 | 0.0 | 116 | High |
| 18 | Alexandria, LA | 45.9% ±3.9 | 17,000 | 0.0 | 93 | Moderate |
| 19 | Gulfport-Biloxi, MS | 45.6% ±4.4 | 51,000 | 0.0 | 52 | High |
| 20 | Fort Smith, AR-OK | 45.6% ±4.3 | 27,000 | 0.0 | 78 | Moderate |
| 21 | Hattiesburg, MS | 45.6% ±4.4 | 17,000 | 0.0 | 85 | High |
| 22 | Anniston-Oxford, AL | 45.5% ±5.3 | 14,000 | 0.0 | 60 | High |
| 23 | Hot Springs, AR | 45.5% ±4.8 | 14,000 | 0.0 | 49 | Moderate |
| 24 | Homosassa Springs, FL | 45.2% ±3.5 | 27,000 | 0.0 | 112 | High |
| 25 | Corpus Christi, TX | 45.0% ±2.5 | 47,000 | 0.0 | 139 | Moderate |
| 26 | Waco, TX | 45.0% ±2.5 | 31,000 | 0.0 | 108 | Moderate |
| 27 | Florence-Muscle Shoals, AL | 45.0% ±5.1 | 20,000 | 0.0 | 58 | High |
| 28 | Mobile, AL | 44.9% ±5.0 | 47,000 | 0.0 | 78 | High |
| 29 | Decatur, AL | 44.9% ±4.7 | 21,000 | 0.0 | 41 | High |
| 30 | Gadsden, AL | 44.9% ±5.2 | 13,000 | 0.0 | 66 | Moderate |
| 31 | Tallahassee, FL | 44.8% ±3.4 | 40,000 | 0.0 | 103 | High |
| 32 | Longview, TX | 44.8% ±2.5 | 33,000 | 0.0 | 98 | Moderate |
| 33 | Beaumont-Port Arthur, TX | 44.6% ±2.5 | 44,000 | 0.0 | 95 | High |
| 34 | Macon-Bibb County, GA | 44.6% ±4.1 | 24,000 | 0.0 | 85 | High |
| 35 | Rome, GA | 44.6% ±4.9 | 10,000 | 0.0 | 49 | Moderate |
| 36 | Hinesville, GA | 44.6% ±3.7 | 6,900 | 0.0 | 94 | High |
| 37 | Amarillo, TX | 44.4% ±2.6 | 29,000 | 0.0 | 82 | Low |
| 38 | Flagstaff, AZ | 44.3% ±4.0 | 14,000 | 10.1 | 13 | Low |
| 39 | Enid, OK | 44.2% ±6.2 | 6,800 | 0.3 | 80 | Moderate |
| 40 | Odessa, TX | 44.0% ±2.8 | 18,000 | 0.0 | 106 | Low |
| 41 | Lubbock, TX | 43.6% ±2.4 | 34,000 | 0.0 | 91 | Low |
| 42 | Sierra Vista-Douglas, AZ | 43.3% ±4.2 | 15,000 | 0.0 | 101 | Low |
| 43 | Fairbanks-College, AK | 43.3% ±4.6 | 9,700 | 105.9 | 0 | Low |
| 44 | Florence, SC | 42.8% ±4.3 | 22,000 | 0.0 | 70 | High |
| 45 | Jonesboro, AR | 42.8% ±4.4 | 13,000 | 0.0 | 66 | Moderate |
| 46 | Minneapolis-St. Paul-Bloomington, MN-WI | 42.7% ±3.9 | 442,000 | 22.9 | 18 | Moderate |
| 47 | Santa Rosa-Petaluma, CA | 42.7% ±3.1 | 51,000 | 0.0 | 26 | Low |
| 48 | Sumter, SC | 42.7% ±4.3 | 12,000 | 0.0 | 58 | High |
| 49 | Memphis, TN-MS-AR | 42.6% ±3.4 | 134,000 | 0.0 | 69 | Moderate |
| 50 | Columbus, GA-AL | 42.5% ±3.5 | 31,000 | 0.0 | 80 | High |
Margins run from ±1.6 to ±6.4 points, so metros a few points apart are statistically tied, and a rank is best read as a neighborhood. 94 metros sit clearly above the national 36.6% and 72 clearly below it. What the margins cover.
Climate, shown beside the number
Weather wears windows out at different speeds. A wood sill in a warm, rainy place rots faster than one in Denver, and a frame that sees 173 days over 90°F a year ages differently from one that sees ten. We show three climate measures next to each metro, but they don't change its rank.
The index estimates one specific thing rather than blending factors into a score. Climate stays separate, so you can weigh it yourself.
- Days below 0°F is the average number of nights a year the low drops below zero. Fairbanks, AK leads with 106; Fargo, ND averages 43.
- Days 90°F+ counts hot afternoons. Laredo, TX averages 185 a year and Phoenix, AZ 173.
- Wood decay risk is the Scheffer climate index, the U.S. Forest Products Laboratory's measure of how fast exposed wood rots given warmth and rainy days. Under 35 is low, 35 to 65 moderate, and over 65 high. All 22 Florida metros rate high. It matters most for wood and wood-clad frames.
All three come from NOAA's 1991–2020 climate normals, taken at the nearest weather station to where the metro's homeowners live, within 500 feet of the same elevation.
How we built it
The federal Residential Energy Consumption Survey (RECS, run by the Energy Information Administration) asked about 18,500 households in 2020 whether their home still has mostly its original windows. We used the answers from 10,127 homeowners in homes built before 2000.
- Survey rates. From RECS, the weighted share of homeowners answering yes, by Census division and the decade the home was built (before 1950, then each decade through the 1990s). The full table is below.
- Homes by decade. From the Census American Community Survey (2019–2023, table B25036), owner-occupied homes in every county by decade built.
- State adjustment. A division's rates don't fit every state in it. RECS samples every state, so we checked each state's own answer against what its division's rates predict for its mix of housing. The gaps were far bigger than sampling noise alone would produce. The biggest were Hawaii (64% vs. 43%) and Mississippi (59% vs. 44%) above their divisions, and Virginia (36% vs. 43%), Kentucky (37% vs. 45%) and Oklahoma (36% vs. 44%) below. So each state's rates are shifted toward its own survey answer, more where its sample is large and less where it's small. This is the standard small-area method (a Fay–Herriot model, the approach behind the Census Bureau's county poverty estimates).
- Combine. For each county, multiply the homes built in each decade by that decade's rate for the county's state, then add up across a metro's counties. Divide by all owner-occupied homes. Homes built since 2000 aren't counted as having original pre-2000 windows, but they stay in the total.
- Margin of error. Each figure has a 90% margin. If the model's assumptions hold and the surveys could be rerun many times, a range drawn this way would contain the true figure about 9 times in 10. It covers three things: the survey's own sampling error (from its 60 replicate weights, the method EIA specifies, which also captures how the decade rates move together), the uncertainty in each state's adjustment, and the Census sampling error on the home counts. It doesn't cover how much one metro differs from the rest of its state, because no federal survey measures that.
Metro areas are the government's 387 metropolitan statistical areas in the 50 states and D.C. (2023 definitions). Rural areas and small micropolitan areas aren't ranked.
A cross-check. Computed straight from the survey, 38.4% of homeowners report original pre-2000 windows. Our county-by-county method gives 36.6%. The gap is mostly that the Census counts more homes built since 2000; its figures run through 2023, three years past the survey.
Checking the model. Two tests, both reproducible from the downloads. First, an internal consistency check: we compared each state's own survey answer with the range the model allows for that state. 49 of 51 fall inside it. With region-wide rates and no state adjustment, only 35 did, which is why we added it. The same survey answers went into the model, so this shows the model fits its inputs; it isn't an independent test of the margins. Second, sensitivity: how much shrinkage we use barely matters. Applying each state's full shift instead keeps 22 of our top 25 metros in the top 25, and the typical metro moves 7 places. Ignoring state evidence altogether would move the typical metro 29 places. Honolulu shows the range: 38.7% with region-wide rates, 51.9% as published, and 61.6% with Hawaii's full shift. Hawaii's own survey answer is 64%. Every metro's three versions are in the CSV.
This is a prevalence estimate. It says how common original pre-2000 windows are, not how many homeowners will replace them, or when.
Survey rates: homes still on mostly original windows
| Division | <1950 | 1950–1959 | 1960–1969 | 1970–1979 | 1980–1989 | 1990–1999 |
|---|---|---|---|---|---|---|
| East North CentralIL, IN, MI, OH, WI | 27%±5 | 28%±5 | 30%±8 | 37%±5 | 62%±7 | 79%±5 |
| East South CentralAL, KY, MS, TN | 47%±8 | 35%±10 | 44%±9 | 54%±9 | 69%±7 | 79%±5 |
| Middle AtlanticNJ, NY, PA | 22%±4 | 24%±5 | 28%±6 | 39%±6 | 59%±6 | 84%±6 |
| Mountain NorthCO, ID, MT, UT, WY | 25%±8 | 30%±14 | 34%±10 | 43%±8 | 53%±10 | 76%±6 |
| Mountain SouthAZ, NM, NV | 42%±21 | 34%±15 | 47%±12 | 53%±9 | 68%±9 | 79%±6 |
| New EnglandCT, MA, ME, NH, RI, VT | 24%±5 | 30%±7 | 35%±7 | 42%±7 | 57%±7 | 77%±6 |
| PacificAK, CA, HI, OR, WA | 32%±7 | 31%±7 | 33%±7 | 39%±6 | 61%±6 | 92%±3 |
| South AtlanticDC, DE, FL, GA, MD, NC, SC, VA, WV | 40%±7 | 27%±7 | 32%±6 | 48%±5 | 63%±5 | 86%±3 |
| West North CentralIA, KS, MN, MO, ND, NE, SD | 37%±5 | 47%±9 | 36%±9 | 40%±6 | 62%±9 | 76%±6 |
| West South CentralAR, LA, OK, TX | 57%±10 | 54%±9 | 57%±8 | 52%±6 | 69%±6 | 79%±5 |
Owner-occupied households, EIA RECS 2020. Each cell rests on 19 to 387 surveyed homes, which is why some margins are wide. These are the division rates before each state's adjustment; the state adjustments (CSV) list every state's own survey answer and the shift applied.
What it can't tell you
- These are modeled estimates, not local counts. The survey is too small to measure each metro directly, so metros in the same state share its rates and differ only in the age of their housing. A metro that replaced windows faster than the rest of its state won't show it. New Orleans rebuilt and re-windowed a great many homes after Hurricane Katrina, so its real share is probably lower than shown.
- "Mostly original" is the homeowner's own answer. Some owners of older homes won't know what was there before them.
- Homeowners only. Renters rarely choose their windows, so rented homes are left out.
- Original isn't the same as failing. A well-made 1990s window can have years left. This estimates where windows are old, not where they're broken.
- It's a 2020–2023 baseline. The survey was taken in 2020 and the home counts run through 2023. Windows replaced since then aren't reflected, so today's shares are likely somewhat lower.
Data and citation
Download the full results for all 387 metros (CSV), which include every metro's home counts by decade, its margin, the climate figures and the weather stations used. The survey rates (CSV) hold the division table above with sample sizes, and the state adjustments (CSV) hold each state's shift. With all three, the estimates can be rebuilt in a spreadsheet.
You're welcome to republish the figures with credit and a link (CC BY 4.0). Suggested citation: The Window Monitor, "Window Replacement Need Index 2026," October 27, 2026, https://www.thewindowmonitor.com/resources/window-replacement-need-index/.
Charts for reuse
Each chart is available as a high-resolution image with the credit built in. Each chart above also has a link to itself and embed code you can paste into an article.
 Where original windows are most common
 Older housing doesn't mean more original windows
 The newer the house, the more likely its windows are original
Window Replacement Need Index: FAQ
›How many U.S. homes still have their original windows?
An estimated 30.3 million owner-occupied homes, or 36.6% of them, still have mostly original windows that went in before 2000, so those windows are at least 25 years old. The estimate combines the federal RECS 2020 energy survey with Census counts of homes by year built (2019–2023).
›Which metro has the highest share of homes with original windows?
Carson City, NV has the highest estimate, 53.9% (±6.4), but 37 other metros are close enough to be statistically tied with it. Among the 34 metros with at least 500,000 owner-occupied homes, Miami, FL is highest at 46.4% and New York, NY lowest at 28.6%. The lowest of all 387 metros is Wildwood-The Villages, FL at 19.1%.
›Does an old house mean old windows?
Not usually. Nationally only 31% of owner-occupied homes built before 1950 still have mostly original windows, compared with 82% of homes built in the 1990s. Older homes have mostly had their windows replaced at least once. Homes from the 1980s and 1990s account for 53% of the homes still on original pre-2000 windows.
Sources
- — U.S. Energy Information Administration, 2020 Residential Energy Consumption Survey, public-use microdata (v7), and its guide to computing standard errors
- — U.S. Census Bureau, American Community Survey 2019–2023, table B25036
- — U.S. Census Bureau, 2023 metropolitan area delineations and 2020 county centers of population
- — NOAA National Centers for Environmental Information, U.S. Climate Normals 1991–2020
- — Carll, C. (2009), Decay hazard (Scheffer) index values calculated from 1971–2000 climate normal data, USDA Forest Products Laboratory, FPL-GTR-179
- — U.S. Geological Survey, Elevation Point Query Service